Skip to content Skip to footer
May 1, 2025

2025 Greater Knoxville Report Card

Introduction

The 2025 Greater Knoxville Report Card is an update to the 2018 and 2019 report cards originally produced by Connect Knox. The Connect Knox initiative was established to track progress on the “Values of a Fully Thriving Knoxville,” a framework developed from the State of Greater Knoxville report by Thriving Cities and refined by the Connect Knox Steering Committee during its August 2017 retreat.

Recognizing the importance of continued evaluation and growth, the Trinity Health Foundation of East Tennessee’s board funded the 2025 update. This investment reflects Trinity’s commitment to identifying critical areas where additional attention and resources are needed. The updated report card is designed to serve as a valuable resource for the region’s nonprofit, governmental, and business communities, offering data and insights to help organizations address community needs more effectively.

Through this effort, Trinity’s board advances its vision of a thriving, connected community in body, mind, and spirit. The findings from the 2025 Report Card will play a crucial role in shaping Trinity’s initiatives, ensuring that future efforts are informed, strategic, and impactful for the overall health and well-being of the community.

Please feel free to download the report and use its findings to enhance our community’s health.

The Data

The Power Up subcommittee of ConnectKnox was tasked with identifying specific metrics for
each of the values selected by the Steering Committee. Recognizing that no indicator can
fully capture progress on any particular value, the committee selected the included set of
leading indicators based on the following criteria:

  • the data must be generally accessible from reputable public sources;
  • the data must be available at the local, state and national levels; and
  • the data must be available on an annual basis for a sufficiently long period of history.

On the following pages, we provide data for our chosen indicators of progress with each of
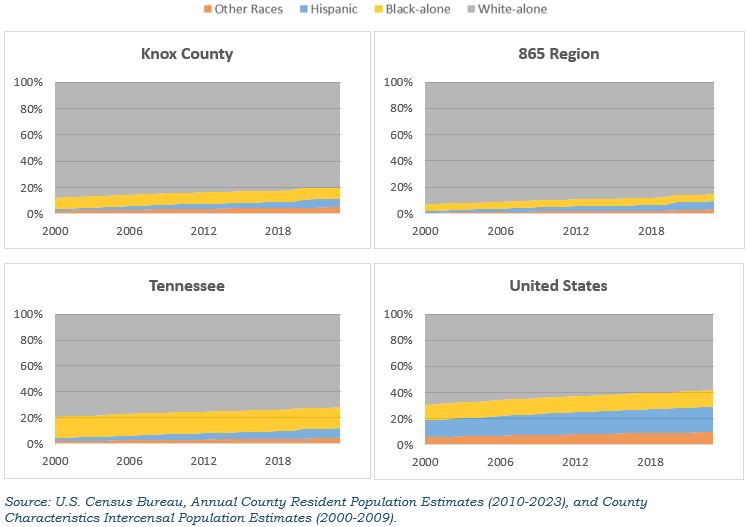
these values. When possible, data are provided for Knox County, for the Knox 865 Region
(which also includes the eight bordering counties of Anderson, Blount, Grainger, Jefferson,
Loudon, Roane, Sevier, and Union), for the state of Tennessee, and for the U.S. Indicators
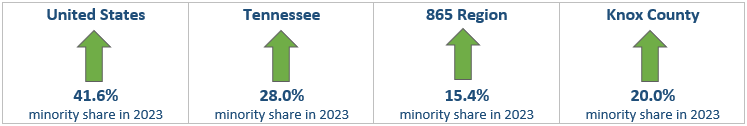
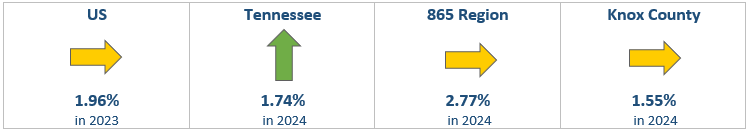
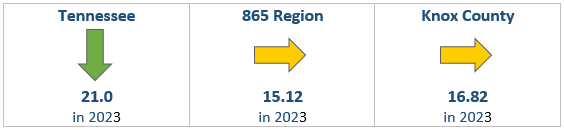
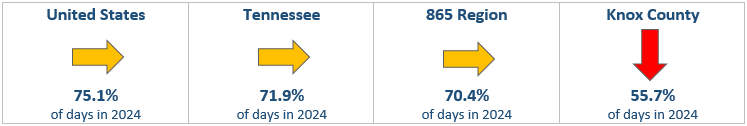
are categorized based on the recent trends: green for “Sustain & Continue to Improve,”
yellow for “Monitor & Understand,” and red for “Prioritize & Act.”

Significant improvements have been observed in key areas of our community. These positive
changes reflect a collective effort and dedication to fostering a healthier environment for all.
While we celebrate this progress, it is essential that we continue to build on these gains,
ensuring sustained growth and ongoing enhancements that will contribute to a stronger,
more vibrant community for years to come.

Values And Indicators

Value Indicator
Beautiful Employment in the arts, entertainment, and recreation industry (share of total employment)
Civically Engaged Election turnout (share of registered voters)
Educated Percent of population ages 25 and above with an associate’s, bachelor’s, or higher degree
Entrepreneurial/Innovative Number of new for-profit businesses
Equitable Gini coefficient of income inequality
Forward Thinking Percent of third-graders proficient in reading
Healthy Years of potential life lost before age 75
Inclusive Population by major racial/ethnic group
Loving/Generous Number of new non-profit businesses
Prosperous Median household income
Safe Rate of crimes against people (per 1,000 population)
Socially/Physically Connected Percent of population ages 16–19 not enrolled in school and not in the labor force
Sustainable Percent of days with good air quality

2019 Values Assessment Overview

Greater Knoxville was certainly thriving in some areas but had work to do in other areas. 


2025 Values Assessment Update

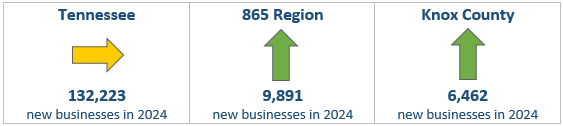
Greater Knoxville has improved on three indicators while losing ground on two others.

Educated

Indicator:  Percent of population ages 25 and above with an associate, bachelor’s, or higher degree

The long-term economic advantages that come with a credential or degree make education beyond high school a valuable investment for individuals. An educated and trained workforce is critical for attracting and retaining high-quality jobs.

Insights:
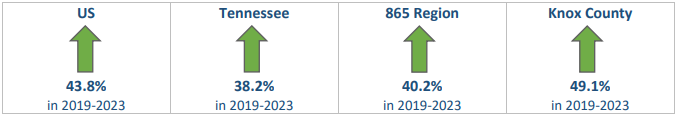
Education is a strong predictor of improved employment opportunities and better financial
well-being. Educational attainment continues to rise across the region. According to 2019-
2023 Census Bureau figures, 285,231 people in the 865 region — 40.2% of the population
age 25 and over — had earned an associate, bachelor’s, or higher degree. This gain of 13.1
percentage points represents the addition of 137,886 people with degrees/credentials since
2000. Knox County led the region and outperformed state and national averages.

Forward Thinking

Indicator: Percent of third-graders proficient in reading

Investments in our children will pay off for generations to come, and nothing captures these investments as well as reading scores among the lowest grade levels. Students are considered proficient readers if assessment scores are measured as “on track” or “mastered.”

Insights:
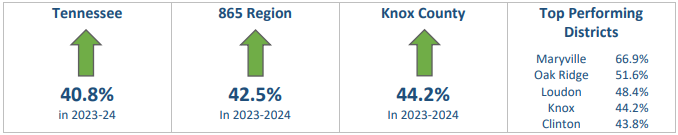
Third-grade reading proficiency has increased for the state, region, and Knox County over the
past several years, following a noticeable dip around the COVID-19 pandemic. During the
2023-24 academic year, 42.5% of the region’s third-graders were proficient (met or exceeded
expectations) in reading according to the standards established by the state Department of
Education. Slightly better was Knox County with a reading proficiency rate of 44.2%.

Prosperous

Indicator: Median household income

There are many possible measures of prosperity, but none as frequently cited is median
household income. Viewed over time, inflation-adjusted income levels paint a very basic
picture of the economic comfort of the region’s residents.

Insights:

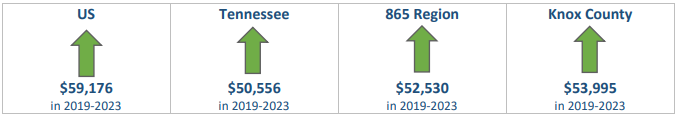
The median income for households across the region was $52,530 in the 2019-2023 data. This represented a solid improvement of 15.9% over the 2008-2012 data in the wake of the Great Recession. Knox County reported a median household income of $53,995 in the most recent data, a 14.2% improvement since the 2008-2012 data. Importantly, the County, region, and state are slowly catching up to the nation in terms of median household income.  Knox County’s median household income was 91.2% of the national median in 2019-2023, up from 89.1% in 2008-2012.

Entrepreneurial/Innovative

Indicator: Number of new domestic for-profit businesses

An entrepreneurial community is characterized by a large and growing number of start-up enterprises.

Insights:

Business formation has entered a new and explosive era since 2019 at all levels in
Tennessee. Statewide, we saw 132,223 new for-profit businesses registered in 2023, of
which 9,891 were in the 865 Region and 6,462 in Knox County alone. These annual totals
are more than double pre-pandemic flows in 2017 through 2019. These new businesses
have created considerable employment and income opportunities for local residents. Indeed,
the continued dramatic and impressive growth in new business registrations in both Knox
County and the 865 Region alongside a tapering off of growth at the state level are a clear
testament to the strong entrepreneurial value of the area.

Equitable

Indicator: Gini coefficient of income inequality

The Gini Coefficient is a commonly used indicator of the distribution of income within a region. It ranges from 0 to 1, where 0 represents perfect equality (where everyone holds the same percentage of total income) and 1 represents perfect inequality (where one person holds all of the income).

Insights:

While income inequality has grown at the national level over the past several years, the picture has been a bit better locally. Income inequality has fallen for Knox County, the 865 Region, and Tennessee in the most recent data as measured by the Gini Coefficient. Knox County saw a decline to a value of 0.483 in the 2019-2023 data, equaling the national level. The 865 Region’s significant decrease, which is based on a population-weighted average of the specific county numbers, was driven by a large drop in population-heavy Blount County.

Inclusive

Indicator: Population by major racial/ethnic group

The Gini Coefficient is a commonly used indicator of the distribution of income within a region. It ranges from 0 to 1, where 0 represents perfect equality (where everyone holds the same percentage of total income) and 1 represents perfect inequality (where one person holds all of the income).

Insights:

The population of Knox County and the 865 Region have become more diverse over the past 23 years with the minority population share in Knox County expanding to 20% of the population. As the county’s population grew, the black or African American population has fallen slightly to 8.4% of the total. The Hispanic population grew from 1.3% in 2000 to 6.4% in 2023. People reporting themselves as other races and two or more races in combination doubled from 2.5% to 5.2%. However, the local degree of diversity lags behind statewide and national trends. Although higher than the region share, Knox County and the state of Tennessee remain less diverse than the nation.

Beautiful

Indicator: Employment in the arts, entertainment, and recreation industry as a share of total employment

There are many ways to measure a region’s health and progress in the arts, entertainment, and recreation, but total employment captures the underlying importance as well as the community’s investment in these areas.

Insights:

The arts, entertainment, and recreation sector of the regional economy provided 11,929 jobs in 2024, a 2.77% share of all employment in privately-owned businesses. The regional share outpaced those at both the state and national levels. This year’s employment represented a slight decline relative to 2023 but is still on par with pre-pandemic levels. Knox County’s 3,717 workers held a 1.55% share of all employment, 1.22 percentage points lower than the regional rate. The star among local performers continues to be Sevier County with 7,128, or 15.2% of its workforce, employed in the sector. Sevier’s dominance in the segment was revealed by its 60% hold on the region’s total.

Loving/Generous

Indicator: Number of new domestic non-profit businesses

While the number of new non-profit organizations is not necessarily the strongest indicator of a region’s generosity or loving spirit, it takes initiative and a strong consideration of others to start a non-profit. 

Insights:

Since 2013 and especially since 2018, Tennessee has seen strong growth in the number of new non-profit businesses registered with the Secretary of State’s office. Both Knox County and the broader 865 Region have seen considerable growth in non-profit formation despite slight declines in the most recent year for the state and region. We view all three series as strong indicators of a consistently generous and loving people, a giving spirit that obviously became stronger in the wake of the COVID-19 pandemic.

Socially/Physically Connected

Indicator: Percent of population ages 16-19 not enrolled in school and not in the labor force

The upper teenage years are a critical period in the lives of our youth. It is important to track the share of this age group who are neither in school nor in the labor force, as being disconnected in this way could be a sign of lost potential.

Insights:

The percentage of disconnected youth declined to 2.8% in Knox County during the 2019 to 2023 period. This 2.2 percentage point drop since 2008-2012 indicates that Knox County’s youth are completing high school degrees and continuing school or entering the workforce at a higher rate than the region, state, and nation. Tennessee has recorded a slightly lower rate of disconnected youth than the national average, continuing the state’s gradual improvement over the survey period. The region surrounding and including Knox County has seen a slight increase in disconnected youth, but the rate remains below the state and nation.

Safe

Indicator: Rate of crimes against people (per 1,000 population)

A safe and stable community help people of all age thrive and achieve well-being. Community safety promotes and requires a participatory environment.

Insights:

Incidence rates of crimes against people steadily fell across the region from 2001 to 2013, but in the past decade, a moderate uptick and subsequent levelling were noted, landing around 15 crimes per 1,000 people. Crime rates have remained lower than those marked in the 2000s. Knox County and the region have consistently reported fewer crimes than the statewide average. However, Knox County saw rates as much as two points higher than the regional average over the past ten years, peaking at 18.09 crimes per 1,000 people in 2015. While similarly-defined data are not available at the national level, the general downward trends shown here are consistent with national trends from national data sources.

Sustainable

Indicator: Percent of days with good air quality

Clean air is one of many measures of a healthy environment and sustainable economy. The health implications of prolonged or frequent exposure to high pollutant levels may be difficult to measure, but the greatest impacts are on the youngest and oldest among us.

Insights:

Air quality in the 865 Region remains largely unchanged following the dramatic improvements during the mid-2000s. “Good” air quality days in Knox County followed a similar trend until a multi-year decline began in 2018. The post-pandemic data for Knox County show a noticeable improvement, however.

Healthy

Indicator: Years of potential life lost before age 75
(per 100,000 population, age-adjusted for comparability)

Everyone who dies before a typical life expectancy of 75 years represents lost potential. This indicator essentially adds up all of this lost potential and then makes adjustments to allow for comparisons across different populations.

Insights:

The measure of premature death has risen steadily locally and for the state and nation at large in the most recent years. Interestingly, the sharp rise in years of potential life lost began two years before the COVID-19 pandemic.  More recent data are not yet available for this measure, although we suspect that the pandemic only worsened this trend.

Civically Engaged

Indicator: Election turnout of registered voters

A civically engaged community takes pride in playing a role in their local, state, and national governments.  This is reflected in voter turnout for Presidential (November), Gubernatorial (November), and County (August) elections.

Insights:

Mid-term/Gubernatorial elections in 2018 drew voters to the polls in higher numbers than in recent years, and this was echoed with the 2020 Presidential election. But voter turnout has fallen across the board since that time. Knox County turnout in the 2022 and 2024 County elections fell below 20%. Regional turnout has been lower than that, and the statewide turnout for the 2024 County election was only 14%. Despite the very low and decreasing turnout in local elections, turnout for the 2022 Gubernatorial and 2024 Presidential elections was quite strong, with the local, regional, and state turnout exceeding the nation.

Acknowledgements

Indicator: Election turnout of registered voters

This report was prepared by Dr. Donald Bruce, Professor of Economics and Director of the Boyd Center for Business and Economic Research at the University of Tennessee, Knoxville, and graduate of Leadership Knoxville (2023). Dr. Bruce was assisted in this effort by Caroline Petersen, a student at the University of Tennessee, Knoxville, majoring in Geographic Information Science and Technology and a participant in Leadership Knoxville Scholars (2026).

The 2018 and 2019 versions of this report card, upon which our work is based, were the product of a partnership between the Knoxville Chamber, Knoxville-Knox County Planning, and the Boyd Center for Business and Economic Research. We are grateful for the foundational work of Joe Riley (Director of Research and Analytics with the Knoxville Chamber) and Tim Kuhn (formerly with Knoxville-Knox County Planning, and now Director of the Tennessee State Data Center within the Boyd Center for Business and Economic Research). We also thank the Tennessee Secretary of State’s Office for providing valuable data for two of the indicators included in this report.

Our work has benefited from the generous support of the Trinity Health Foundation of East Tennessee and the tireless advocacy of Laurens Tullock. We also appreciate the perennial support of Tammy White, Samantha Lacy, and the entire Leadership Knoxville team.

Complimentary copy of report